Blade API Monitor 3.7.8.6 Details
Shareware 2.31 MB
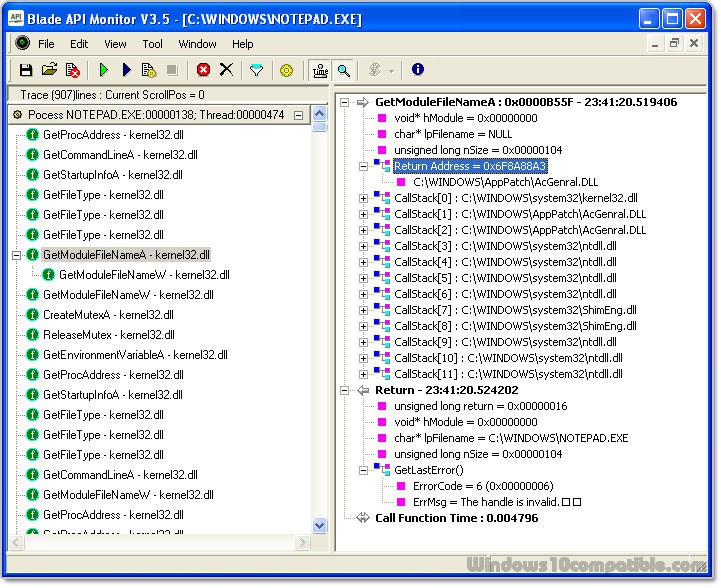
Blade API Monitor, a useful developer spy tool, can trace and log API and ActiveX interfaces with parameters. It can trace any exported functions, internal functions, MFC Class method, functions in source code and ActiveX controls and COM objects Interfaces, and can log all API Call Information. It supports MAP PDB Files, Unicode and ANSI application and multi-thread, etc. It also can predefine 27 API Filter Profiles and 8000+ APIs' prototype.
Publisher Description
 Blade API Monitor is a useful developer spy tool which can trace and log API and ActiveX interface with parameters. The key features are:
Trace any exported functions of any DLLs, including Windows API and any other 3rd-Part APIs, unnecessarily to know the prototype of the functions;
Trace NT Native API and undocumented APIs;
Trace MFC Class method, including MFC42 MFC80 MFC90;
Trace ActiveX controls and COM objects interfaces;
Trace internal functions code with Map (MSVC, DELPHI, C++Builder, IDA, ...) File;
Trace functions in source code with PDB (MSVC) and source files;
Log all API call information, including function name, call sequence, start time, return time, call stack, thread id, input and output parameters, function return value, GetLastError code, OutputDebugString, exception, CPU context and more;
Support debug version and release version with no modifications to the target application; Support Unicode and ANSI application;
Support multi-thread;
Presets 27 API Filter Profiles, including Handles and Objects, Dynamic-Link Libraries, Event Log, Pipes and Mailslots, Debugging, Windows Classes, COMM, Application Related, Shell, Dialog Boxes, File System, Services Related, Remote Access Service, Memory Management, Print Related, Windows, Registry, Processes and Threads, File IO, WinInet, Windows Sockets, Multimedia API, Windows GUI, Network Management, WinNT Security, Access Control Functions;
Easily generate PDB files without source code;
Support Script Macro;
Predefine 8000+ APIs' prototype.
Blade API Monitor is a useful developer spy tool which can trace and log API and ActiveX interface with parameters. The key features are:
Trace any exported functions of any DLLs, including Windows API and any other 3rd-Part APIs, unnecessarily to know the prototype of the functions;
Trace NT Native API and undocumented APIs;
Trace MFC Class method, including MFC42 MFC80 MFC90;
Trace ActiveX controls and COM objects interfaces;
Trace internal functions code with Map (MSVC, DELPHI, C++Builder, IDA, ...) File;
Trace functions in source code with PDB (MSVC) and source files;
Log all API call information, including function name, call sequence, start time, return time, call stack, thread id, input and output parameters, function return value, GetLastError code, OutputDebugString, exception, CPU context and more;
Support debug version and release version with no modifications to the target application; Support Unicode and ANSI application;
Support multi-thread;
Presets 27 API Filter Profiles, including Handles and Objects, Dynamic-Link Libraries, Event Log, Pipes and Mailslots, Debugging, Windows Classes, COMM, Application Related, Shell, Dialog Boxes, File System, Services Related, Remote Access Service, Memory Management, Print Related, Windows, Registry, Processes and Threads, File IO, WinInet, Windows Sockets, Multimedia API, Windows GUI, Network Management, WinNT Security, Access Control Functions;
Easily generate PDB files without source code;
Support Script Macro;
Predefine 8000+ APIs' prototype.
Download and use it now: Blade API Monitor
Related Programs
GPU Monitor
With this GPU Monitor gadget you can display your Vendor, Model, GPU (Clock Speed, Temperature, Usage), Memory (Clock Speed, Size, Usage), Fan (Speed, Usage), Shader Clock Speed, PCB Temperature and PCI Express. It does not require any 3rd party applications....
- Freeware
- 20 Jul 2015
- 721 KB
Battery Monitor
Battery Monitor is a small widget that shows on the desktop the current battery details of your notebook, as the name implies. It comes bundled with numerous customization preferences, in order to please even picky users. The interface is based...
- Freeware
- 20 Jul 2015
- 407 KB
Weather Monitor
Weather Monitor is a lightweight and non-obtrusive program that can help you see the current and future weather conditions in your city. The program?s interface resembles many of the Windows Widgets in their simplicity, which means that any type of...
- Freeware
- 20 Jul 2015
- 731 KB
DNS Blacklist Monitor
DNS blacklist (DNSBL) monitor software is used to monitor your email server public IP address in DNS blacklist zones like zen.spamhaus.org and many others. Why you should use DNS blacklist monitor software Blacklist monitor software lets e-mail system administrators know...
- Demo
- 20 Jul 2015
- 2.9 MB
System Monitor II
System Monitor II - Windows Gadget To Display System Health In Real Time. It shows you all core CPU usage (supporting up to 32 cores/threads) and RAM usage (physical, page file and full, includes virtual). It also displays all cores...
- Freeware
- 20 Jul 2015
- 731 KB
Screenshot